


“You like potato and I like potahto
You like tomato and I like tomahto
Potato, potahto, tomato, tomahto
Let's call the whole thing off”
Song by George & Ira Gershwin (1937)
You say continuous, I say continual
No! Don’t let’s call the whole thing off! Improvement is much too important for that. I’m talking about the debate as to whether to say continuous improvement or continual improvement.
Is it Continuous Improvement or Continual Improvement?
There seems to me to be a never ending debate over the use of continuous and continual when referring to ongoing improvement in your business or any other type of organisation. Really they mean the same thing.
There is an important distinction to this though.
As a follower of that great management and quality thinker and teacher Dr W Edwards Deming, I use continual. Deming suggested that the important difference, according to his mathematical dictionary, was that continual meant ongoing but discontinuous.
But why?
As a follower of that great management and quality thinker and teacher Dr W Edwards Deming, I use continual. Deming suggested that the important difference, according to his mathematical dictionary, was that continual meant ongoing but discontinuous.
Well, adding value for customers and giving them a great total customer experience is what should be continuous and the first part of daily work. Continual improvement is the second part of daily work that keeps your total customer experience fresh.
I’m going to be using continual.
Why do Continual Improvement anyway?
So why should your business or other type of organisation do continual improvement?
Whichever way you spell it this should be viewed firstly as a fundamentally different way of managing and working in your business. It aims for excellence not minimum standards, which should then lead you to having a competitive advantage.
“Competitive advantage you say?”
Yes, and it is not how you do continual improvement, i.e. the tools and techniques, that is important. It is this why that is crucial if your business is going to be successful, resilient and sustainable over the long term.
Continually improving aids the delivery of products and or services ever better, faster for less.
Whilst the tools and techniques can be really helpful, the most important thing is a thinking and learning mindset that uses them. It should go without saying that this needs to be accompanied by an openness to change.
Are you open to change; constantly evolving everything to do things ever better?
Why? Because the world around you, including customer needs and the marketplace, is constantly changing around you.
Yes, but
“Ah yes! But we do project-based improvement.”
Good! However, too many project-based improvement projects look like the red line below when compared with continual improvement and occasional. You’ve got to keep it going; keeping the thinking and learning going.

Over time in a conventional situation performance is highly likely to degrade. This can be due to a number of factors, such as equipment can wear out, people not working to process and perhaps management priorities changing...
Once a step of continual improvement has taken place the revised process must be standardized. This means it is documented and it is ensured that any personnel working in the process are always properly trained and the skills maintained over time.
The diagram above implies ongoing steps of improvement will be accompanied by increased knowledge leading to awareness of new opportunities to improve. Eventually increasing knowledge can lead to the opportunity to innovate.
This greater knowledge can provide a better basis for innovation. This is especially true if people working in a process are engaged and their contribution encouraged. Indeed they should be encouraged to drive the continual improvement.
What actually is it?
Having said that continual improvement is about thinking and learning, what principles is it based upon. In summary these are as follows:
A focus on delivering ever better value to the consumer
Takes a holistic/systemic approach, viewing work as interrelated processes
Aims for excellence
Puts people first whilst taking a scientific, evidence-based approach to improvement
Replaces conventional ‘problem solving’ with ongoing, methodical improvement
Uses the visual management tools
How do you do continual improvement?
At the heart of continual improvement is the Deming Wheel or Study-Act-Plan-Do (SAPDo) Cycle. You saw this in the graphic at the start of this article and here it is again:
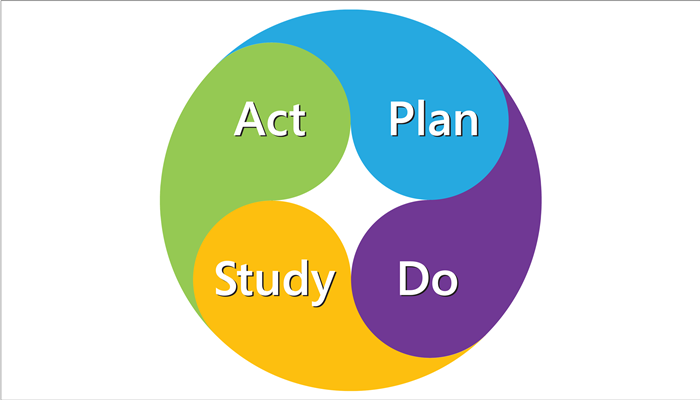
You may have seen or even use it in the form of Plan-Do-Study-Act (PDSA) or even Plan-Do-Check-Act (PDCA). There are two reasons why I recommend SAPDo.
The first is the unfortunate implications of using ‘Check’ in PDCA instead of ‘Study’. Check, particularly in North America, check means put a tick in the box. Continual improvement is absolutely NOT a box ticking exercise!!!
The second reason for using SAPDo, putting ‘Study’ first, is that you actually have to notice what is happening or have noticed something is or has happened. Again we are talking about a thinking and learning mindset.
Added to this is that usually we are, as psychologists might say, ‘always and already in the middle of life’. Stuff is happening all around us. Are you aware and noticing? It is this awareness that can lead you to competitive advantage. So start with ‘Study’.
A continual improvement process
Here is the table from the beginning of this article again showing the steps in the process below.

Even more powerfully this process should be used in conjunction with the A3 Report. I covered this in my blog of 13 May 2019. Below is the example of an A3 Report that I used in that blog:

SAPDo+A3 Step 1: Study
In applying SAPDo, as we saw in the May blog, study covers the left hand side of the A3. It starts with a description of the problem situation, which may include a Process Behaviour (PB) chart. PB charts help use measurement as rational basis for action.
A PB chart is a way to properly analyse serial data. I have covered this before in my blogs. Basically it is a graph of data against time. You add to this three decision lines. Most importantly, these are calculated from the data.
Some people refer to a PB chart as a Statistical Control Chart and it is also used in Six Sigma. And too many people try to make this more complicated than necessary, IMHO. Hey, it’s just a graph of your data with decision lines!
However, used properly a PB chart can be, with careful thought, one of the most powerful drivers of continual improvement, making continual improvement part of your daily work.
The central green line is the arithmetic mean or average. The two red dotted lines are the boundaries within which 99 to 100% of the data will fall IF, and it is a big if, the process is stable and predictable. If not it needs immediate improvement.
You can see a PB chart in the Problem Situation section of the A3 Report example. Can you see the two red points above the top decision line and one below? This process or system is not stable and predictable!
If you would like my simple worksheet for calculating the decision lines do please contact me.
At this point it is really helpful to map (flowchart) the process.
In the bottom left of the A3 is the Problem Analysis, which is digging down to identify and understand the possible root causes of the problem. This can be helped by using the 7 Quality Control tools.
Two of these, the Pareto chart and the Fishbone Diagram, are shown in the problem analysis box. Other methods such as the 7 Management & Planning tools, Quality Function Deployment and Design of Experiments may help.
The example A3 shows the root causes that have been identified at the bottom of the problem analysis box. I’m going to write a future blog on the diagnosis of root causes.
“But…” I hear you say, “I have no points outside the decision lines!” Great start!
The next things to look at are whether the average is where you need it and whether the variation, the distance between the upper and lower decision lines, is acceptable. If you are then looking to improve performance and or quality still follow the steps below.
SAPDo+A3 Step 2: Act
Once the root cause or causes have been identified someone has to make a decision to put in place countermeasures or make changes, on a stable process or system, in some way to improve performance and or quality.
SAPDo+A3 Step 3: Plan
In the A3 example I have combined ‘Act’ with the next stage ‘Plan’ SAPDo stages in the top right hand Corrective Action Plans box. There you can see an indicative Gantt chart for an implementation plan for countermeasures to the four root causes.
Depending on the complexity of the countermeasures, and quite often obtaining the resources then required, clearly there may need to be many more detailed steps in the Gantt chart.
In this example there is an assumption that the same data would be used as in the initial problem situation. Naturally if no data was available initially or there were problems with it, then new measurements would need to be specified and taken, along with any necessary additional testing.
SAPDo+A3 Step 4: Do
In the ‘Do’ stage of SAPDo the changes are made and the process or system is then run for a period of time to evaluate the effectiveness changes. Clearly sufficient data must be collected to enable proper assessment of the effectiveness of the changes.
SAPDo+A3 Step 5: Study
Looking at the example A3 you can see a PB chart in the ‘Apply and Results’ box. In this example it is clear that a significant improvement has been made. In this case the whole system was changed.
Normally one might see much smaller changes that would be indicated by signals in the PB chart. These would lead to the decision lines being recalculated and then run on to monitor the ongoing performance of the revised process or system.
All this is provided that the changes have worked!
SAPDo+A3 Step 6: Act
And if the changes have not had the desired effect decisions have to be made on alternative countermeasures, perhaps incorporating any new insights that have been learned from running the previous ones.
Ideally of course the changes will have made an improvement. The question then is can changes be made to further improve the situation? In reality the learning should never stop and neither should improvement. That’s why it’s called continual improvement!
Bottom line
Change must be constant to keep the total customer experience fresh. Therefore you have got to keep on doing something!
Using continual improvement emphasizes improvement is ongoing but discontinuous; it is adding value that should be continuous.
The starting point for continual improvement is your values in action, which support directly and indirectly continual improvement of the total customer experience.
It is the second part of daily work.
Continual improvement is a central element of achieving ever-better, faster for less with your products and or services.
Use an improvement process to ensure effective projects.
Drive all improvement activities using the SAPDo cycle.
An A3 improvement report makes an improvement project visible to everyone.
A methodical way to help understand cause and effect can be based on the fishbone diagram.
If you have any questions or would like to make an appointment to discuss our Coaching Six-Pack do contact us via the button below. Please do include your email address, which we will only use to send information to you.
Thank you for reading this blog. Hope you have enjoyed it and found it useful. If you have any other questions do please use the contact page. Do please share this blog with your friends, colleagues and connections. Looking forward to sharing my next blog with you.