
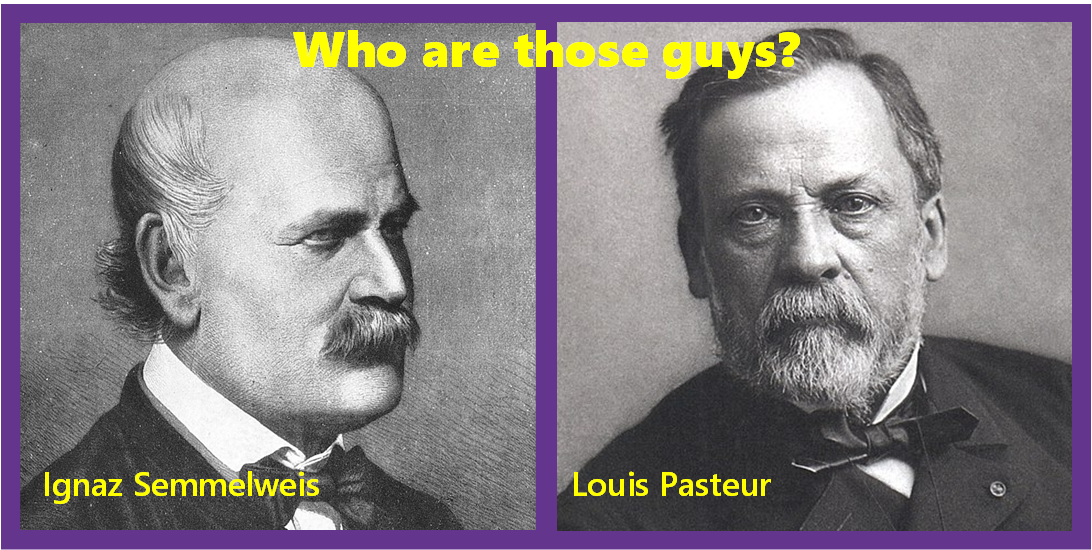
Yes, who are those guys?
And anyway, why should they be of interest to managers today?
First, let us go back to 1847 Vienna. Women were dying in maturnity clinics due to puerperal or “childbirth” fever. Physician and scientist Ignaz Semmelweis noticed that the incidence of death of mothers in one clinic was twice that in another.
The one with the higher maternal mortality rate taught medical students, whilst the other taught midwives. He eliminated a number of possible reasons for the difference. Then his friend, who was another physician, died after being accidentally stabbed by a student during a post mortem examination.
An autopsy revealed a similar pathology to the women who were dying. Semmelweis concluded that a higher percentage of women were dying due to "cadaverous particles" that he and the students carried on their hands when going from autopsies to examining patients in the first maturnity clinic.
He instituted strict hygene using an anticeptic solution when moving from autopsies to making examinations. The result was the mortality rate in the women plumented. Over time Semmelwies and his students tried to share their new knowledge with the rest of the Viennese medical profession without success.
Sadly, Semmelweis had no success gaining acceptance of his findings, his career nose-dived and he was treated as an outcast, eventually dying a broken man in 1865 in an insane asylum. Partly his lack of success in the acceptance of his findings was due to not being able to provide a deeper theoretical explanation for what was happening.
Publication of Semmelweis’ practical findings did spread around Europe. However, it was not until 1870 that Louis Pasteur’s work offered the theoretical explanation for Semmelweis' observations: the germ theory of disease. Scientific thinking, proper observation and experiment, had eventually won through.
A Germ Theory of Management
Coronavirus is not the only germ about today 150 years after the discovery of infection. The early stages of Covid-19, were characterised by entrenched political views, especially as we saw in the UK and USA. These seem to echo those behaviours of early 19th century surgeons.
This lack scientific thinking in dealing with a challenge has killed tens of thousands.
We also see this lack of scientific thinking in the behaviours of much of today’s top management. It kills companies in the private sector and people, directly or indirectly, who are receiving public sector services.
150 years ago, Semmelwies had faced entrenched ideas and practices in medicine and a resistance to new ideas. Today we still face resitance to change in entrenched management practices. Thirty years ago this led the late Dr Myron Tribus christening this latter issue as the ‘Germ Theory of Management’.
Unfortunately, not much seems to have changed since.
Typical of these fixed management mindsets are that command and control mangement is still rife and too many decisions being made arbitrarily or based on assumptions, misunderstandings and biases. Add to to these shortermism and top management often being driven only by the mantra of shareholder value.
Just when it seemed that ways were changing with the advent of algorithms and big data, we got the financial crisis of 2008. It has been said that one problem was management fixated on short-term thinking, which may have influenced the analysts’ short time horizons when using data in analysis and algorithms.
There is plenty of explanation backed by theory and practice for a better way to manage. However, whilst good in some places, too much of management has not accepted that there is a better way.
What is required in today’s fast-changing world is management thinking scientifically. That is, managers making decisions based upon knowledge from understanding the behaviour of tangible things by observation and experiment.
The Virus of Variation

The problem of poor decision-making by management is particulary serious when it comes to using data properly. Why? Well there’s a germ on the lose in your data. ALL real-world data is messy and variable as in the graph below. We call this effect the Virus of Variation.

Copyright Alan C Clark 2020
In the real-world, as someone once remarked, “Some days are better than others”.
So how do you make an effective decision based what the data might be telling you? In the case that these numbers represent weekly sales data, you can image a CEO not being at all happy that they reached an all-time low.
Real-world data such as this will vary randomly because whatever is being measured will be influenced by complex relationships between internal and external factors acting on the system or process. So think of the measured data has having the virus of variation cuased by these multiple influences.
An aside here. When a radio is tuned between stations you hear a hissing sound that engineers call noise. You get this in all electrical and electronic systems. When you tune in to a station and are receiving it you are getting the signal sent by the radio station.
If you were to look at the hiss on a screen you will see a random wiggly line. On signal there would be a more orderly patern. The wiggly line above shows that this real-world data is noisy.We’ll use signal and noise a bit later.
The treatment for the virus of variation starts with management thinking scientifically and basing decisions for action on evidence. Data provides that evidence; however, it must be analyzed properly. A good start is by plotting a series of data points in a line graph as above, which puts the latest number into a context.
The line graph of data against time above shows considerable point-to-point variation over time. And yes, some weeks are better than others! But how much variation is routine and to be expected from this process as it is now and how much is exceptional requiring management attention?
Fortunately some clever folks came up with what we’ll call decision lines to help us identify the usual or routine behaviour of the data from the process and those that are unusual or exceptional. And below they are applied to the line graph shown above.

Copyright Alan C Clark 2020
The red and green decision lines now give you references for the data points. The green line is the Average for this data set. The two red dotted lines we’ll call the Upper Decision Line and the Lower Decision Line. A line graph against time with these decision lines is called a Process Behaviour (PB) chart.
Without going into the mathematics and statistics behind the calculations, we’ll just say that 99 to100% of the data points will be between these two lines if the process and its data is stable and predictable.
We’ll leave that maths and stats for another day. Alternatively you can talk to me off line.
Now we have the decision lines telling us that as long as the data points are randomly varying between the two red dotted line then the process or system is stable and predictable. There is a signal for action because something exceptional has ocurred shown by one of these two events:
A data point is outside either the Upper or Lower Decision Lines
If there is a run of eight points on one side of the average
Ideally the PB chart is run in real time. Immediately there is a signal due to rule 1 or rule 2 it should be investigated to find the cause. In the PB chart above, you can see examples of rule 1 outside the decision lines highlighted in red.
You will also notice that the first nine points are below the average. The process was working differently then. And actually towrds the end there another eight below the average. Why was that?
If this PB chart was constructed with historic data it would be time to ‘Go and See’ why that was by talking directly to those working with it.
If you use a PB chart you can learn:
If it is safe to take action on or to make a prediction from a set of performance data from a business process.
You can separate signals for action from the noise of random variation in performance data.
You will be able to tell whether any process change that you have made makes an improvement or not.
If you take action based on a single point alone or within tabulated data you will miss an important learning opportunity. You are actually just guessing. This is as true whatever the sector or process. The virus of variation is infecting your data and will defeat you!
Bottom Line
The question is will you go on like those surgeons in mid-19th century Vienna killing their patients or will you acknowledge what the Germ Theory of Management is telling you. That is, if you are seriously interested in improving performance, as a manager you need to be thinking scientifically.
By putting your data in PB chart you both present and analyse data providing an evidence base for performance improvement. You can get all sorts of specialist software to do this, but you can also use a spreadsheet. And, it is so simple that you can even use good old pencil and graph paper. Good eh?
Thank you for reading this blog. Hope you have enjoyed it and found it useful. If you have any other questions do please use the button above. Also do please share this blog with your friends, colleagues and connections. Looking forward to sharing my next blog with you.
PS
I also offer a FREE 45 minute Discovery Session if you personally want to change things and might like me to coach you through solvable problems. [Solvable problems are those where everyone involved understands that they will have to make changes to resolve problems.]
PPS
If you would like to read more about the implications of The Germ Theory of Management by Dr Myron Tribus two sources are avaialble. In the UK a booklet is available from The Deming Transformation Forum. In the USA a paper on it is included as one of four contained in ‘Avoiding Man-Made Chaos’ published by SPC Press.